Financial Technology Market Observations
FinTech Market Update
- In Q2 2025, global FinTech M&A activity reached 473 transactions, maintaining elevated levels for the second consecutive quarter following the Q4’24 decline. This momentum reflects continued strategic consolidation as incumbents accelerate digital transformation initiatives.
- The total FinTech deal activity (Financing, M&A & IPO) in Q2 2025 exceeded $10.5 billion in funding, representing the second consecutive quarter above $10B threshold since early 2023.
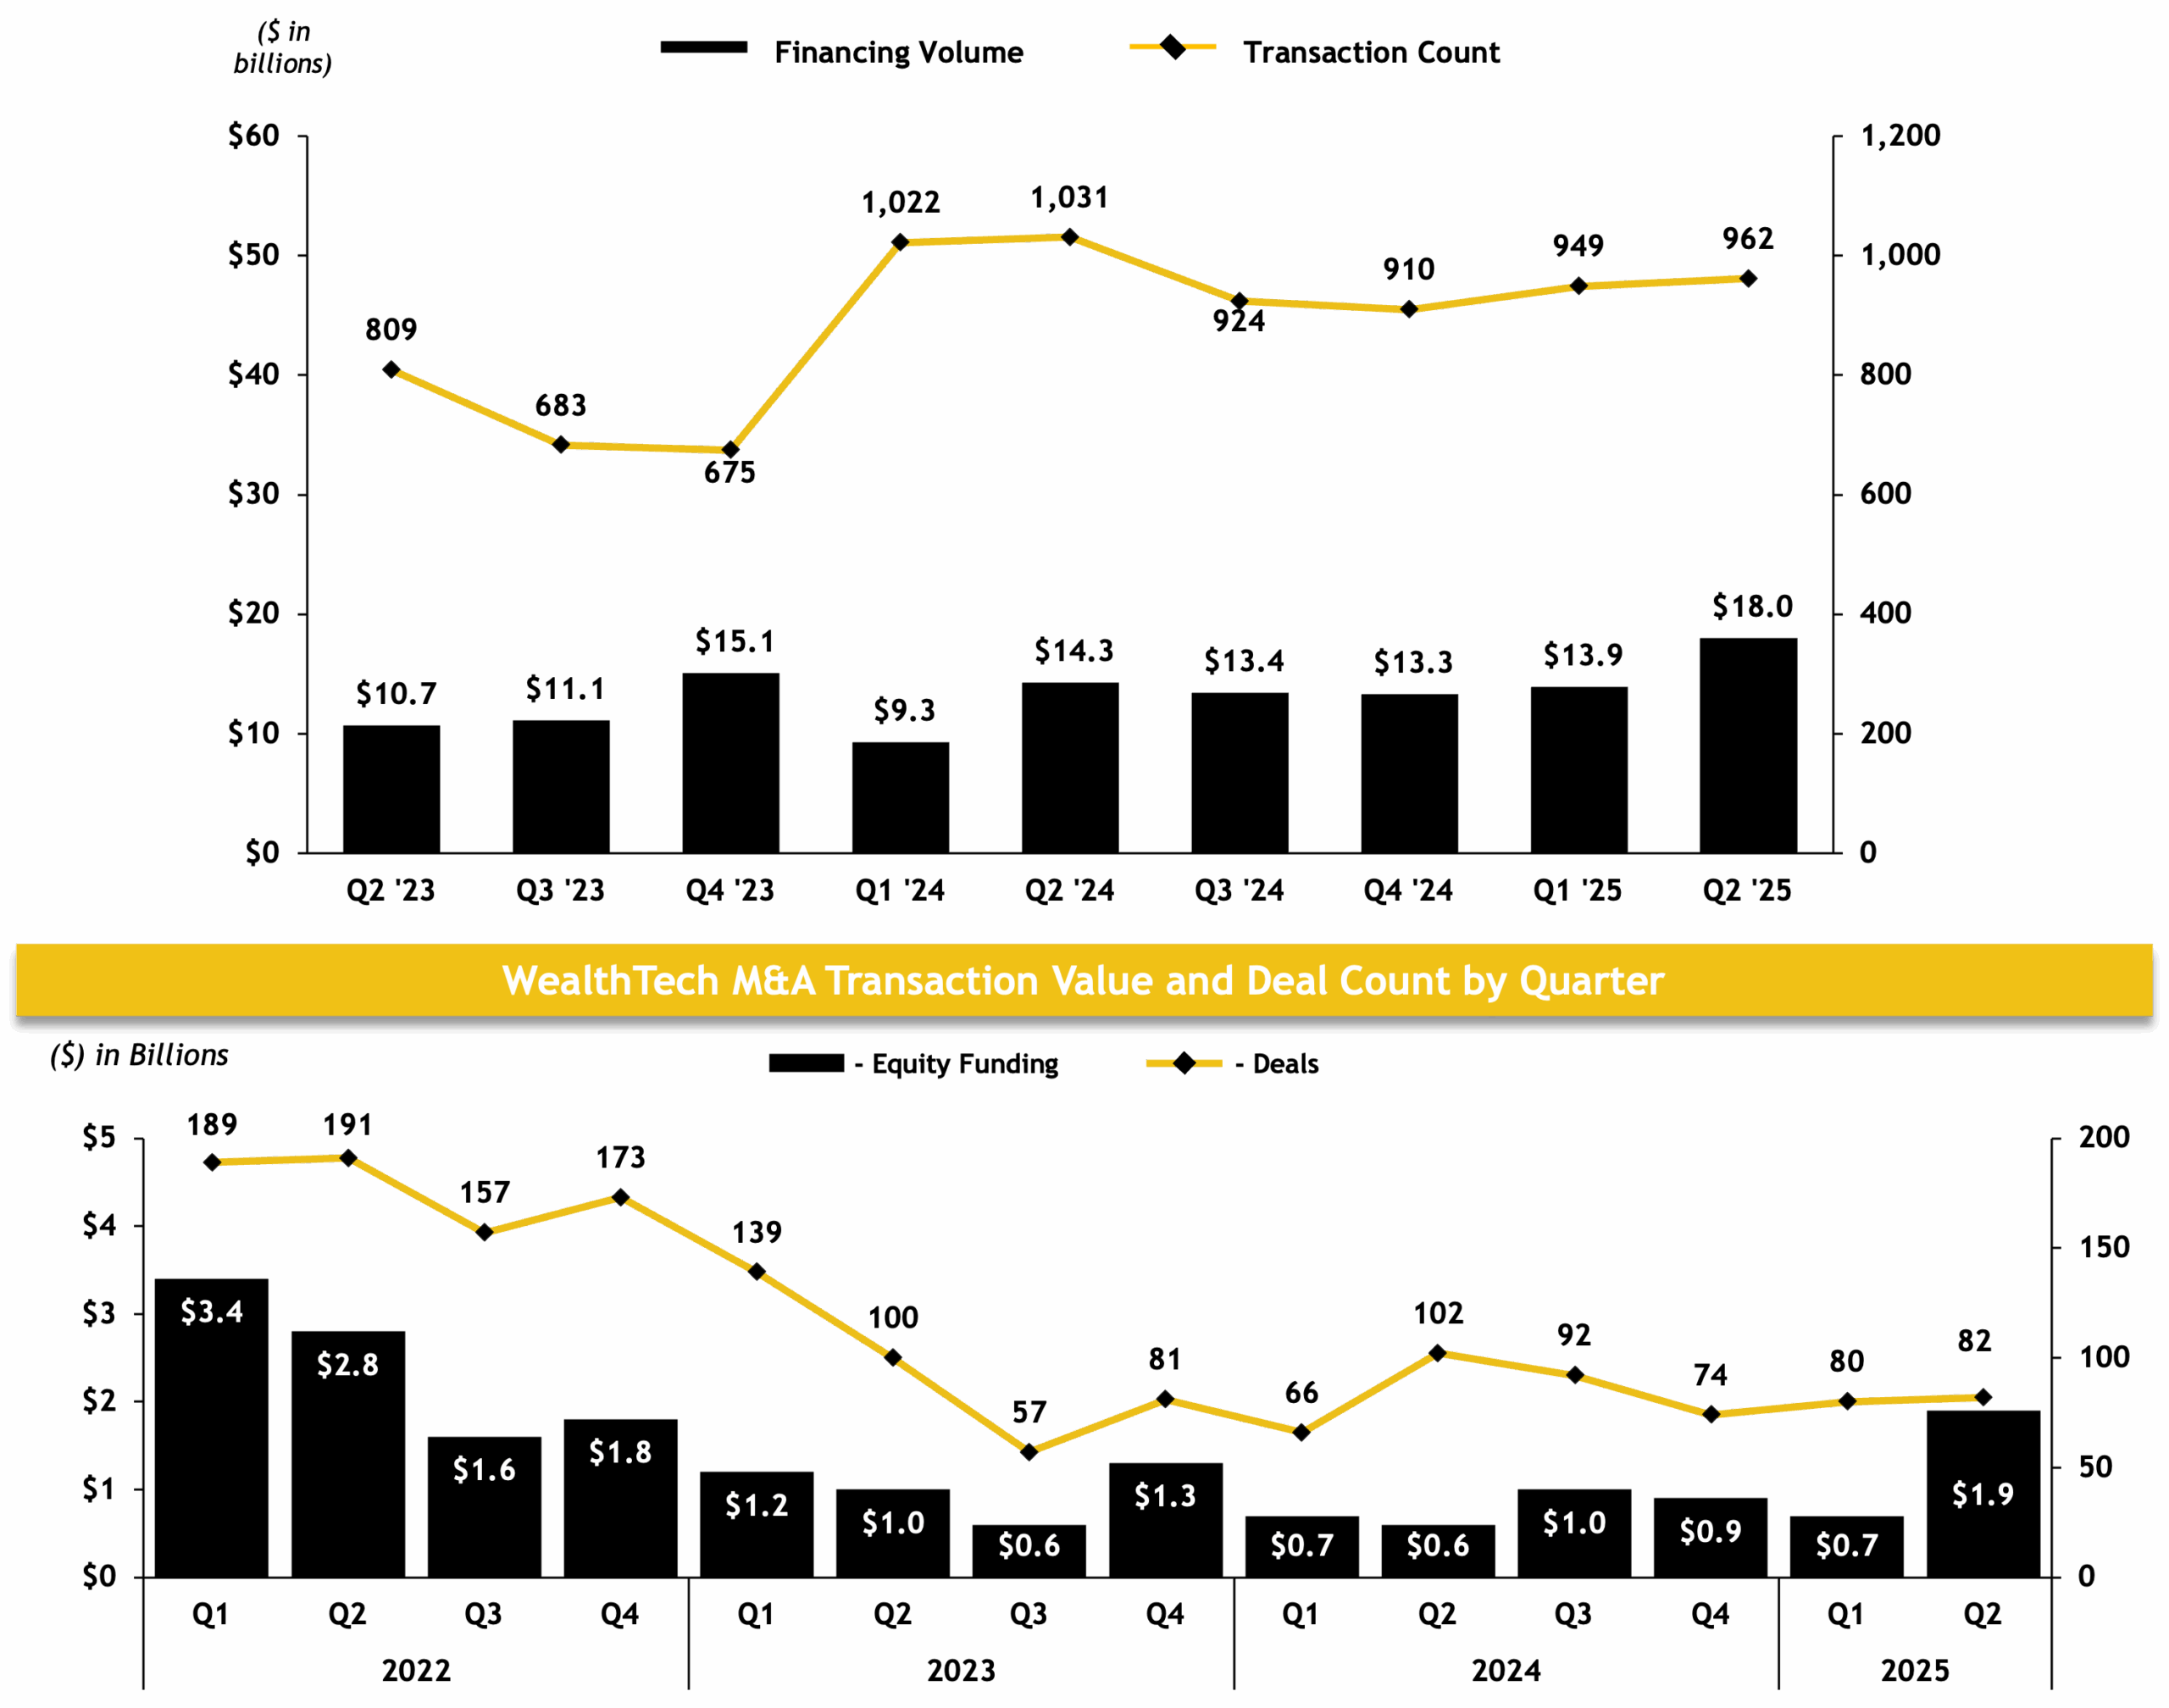
- FinTech financing in Q2 2025 totaled $18.0 billion across 962 transactions, with mega-rounds ($100M+) comprising 40% of total funding despite representing only 23 deals, indicating continued preference for larger, more mature fintech investments.
- Major M&A transactions included Global Payment’s $24.3B acquisition of Worldpay, Xero’s $2.5B acquisition of Melio, and Coinbase’s $2.9B purchase of Deribit, highlighting both embedded finance consolidation and crypto infrastructure scaling strategies.
- Digital assets companies drove significant exit activity, with Circle’s $6.9B public debut, Stripe’s acquisition of Privy, and multiple crypto-focused M&A deals demonstrating institutional adoption momentum.
- B2B fintech solutions dominated major deal activity, capturing 60% of top payments investments and 50% of largest banking rounds, as enterprises prioritize financial infrastructure modernization and embedded finance capabilities.
Industry Snapshot
$1.9B
WealthTech funding in Q2 2025, highest level since 2022
316%
QoQ increase in WealthTech funding
$5.0T
Estimated global digital wealth management assets under management (AUM) in 2024
27.1%
WealthTech public company stock performance growth over the past year, outpacing broader FinTech indices
65%
U.S. financial advisors report using digital wealth platforms for portfolio management in 2025
40%
New digital wealth clients are under 40 years old